Week 1 · Module 1
Overview of the Financial System
Financial Institutions and Markets · MF50004.01
Prof. Jiajun Jiang · School of Economics, Fudan University · Semester 1, 2026–2027
Financial Institutions and Markets
A financial system moves money from the people who have it to the people who can use it. This course is about the machinery that does the moving — markets, banks, funds, and the rules they operate under — and about why that machinery is built differently in different countries.
Start from a rule — who may issue a security, who may lend, whose deposits are guaranteed — and follow it through to a price or to the size of a market. This week’s example: China moves savings mainly through banks and the United States mainly through securities markets, by a factor of about four either way.
Your instructor
Jiajun Jiang 江嘉骏
Associate Professor of Finance, School of Economics
- Ph.D. Economics, Peking University (2018)
- B.S. Mathematics, Peking University (2013)
- Visiting scholar, NYU Stern (2016–17)
- jiangjj@fudan.edu.cn
- Office hours by email appointment — School of Economics building, Room 1005
- Behavioral finance
- Household finance
- FinTech
- Narrative economics
Logistics
| When | Monday and Thursday, periods 6–7 |
| Where | H6508 |
| Course materials | elearning.fudan.edu.cn — slides posted before each class. You are registered automatically; tell me if you are not |
| Teaching assistant | Yiwei Meng — 25300680197@m.fudan.edu.cn |
| Office hours | By email appointment — School of Economics building, Room 1005 |
Textbook
Frederic S. Mishkin and Stanley G. Eakins, Financial Markets and Institutions, 9th Global Edition. Pearson, 2018.
The weekly reading is short — two chapters at most. Its data stop around 2016, so read it for how things work and take the current numbers from the slides.
Marlene Amstad, Guofeng Sun and Wei Xiong (eds.), The Handbook of China’s Financial System. Princeton University Press, 2020. Free to read online.
The institutions it describes still hold. Its numbers are 2019–20 and several are now wrong; where that happens the slide carries the current figure and its source.
Every number in this course carries a date and a source. That is also the habit your research paper will be marked on.
How the course is assessed
| Component | Weight | What it is |
|---|---|---|
| Attendance | 5% | You are expected in the room |
| Participation | 5% | Discussion, polls, cold calls, case debates |
| Assignment 1 | part of 40% | Asset valuation and risk measurement — set Week 2, due Week 4 |
| Assignment 2 | part of 40% | Financial markets and investment instruments — set Week 8, due Week 10 |
| Group case study | part of 40% | Presented in Week 12 |
| Research paper | 50% | On a Chinese market or institution you choose |
The twelve weeks
| Week | Topic | Textbook | |
|---|---|---|---|
| Module 1 | 1 | Overview of the financial system | Mishkin 1–2 |
| Module 2 | 2–3 | Interest rates, risk, return, market efficiency | Mishkin 3–6 |
| Module 3 | 4–5 | Intermediation, crises, central banking, FinTech | Mishkin 7–10 |
| Module 4 | 6–8 | Money, bond and stock markets | Mishkin 11–13 |
| Module 5 | 9–11 | Banks, funds, and non-depository institutions | Mishkin 17–22 |
| Module 6 | 12 | Group case presentations and synthesis | — |
What this course covers, and what it does not
- Weeks 1–3 — overview, interest rates, risk and return
- Weeks 4–5 — intermediation, crises, central banking, FinTech
- Weeks 6–8 — money, bond and stock markets
- Weeks 9–11 — banks, funds, non-bank institutions
- Week 12 — group case presentations
- Derivatives markets in depth
- Commodity markets
- Real estate and mortgage markets
- Foreign exchange and the international monetary system
- Insurance as a standalone industry
These exclusions are other courses, not judgments about importance.
This week
- Why financial markets and institutions matter
- How financial markets are organized
- Why financial intermediaries exist
- China’s financial system and its regulators
Both meetings end on a real, named case with a decision to make. That is the shape of every week from here.
Meeting 1
Session 1 · Why financial markets and institutions matter
Session 2 · How financial markets are organized
90 minutes · theory and developed-market evidence · closes on the stablecoin classification case
Session 1 · 45 minutes
Before anything else
AhaSlides word cloud · 4 min
In one word: what does a financial system actually do? Scan to join
Two questions this course keeps returning to
Where claims on future income are priced and traded.
- How are prices set?
- What makes a market liquid?
- Why do identical claims trade at different prices in different places?
Who stands between savers and borrowers, and why.
- Why not just trade directly?
- What does an intermediary actually produce?
- What happens when one fails?
Overview of the financial system
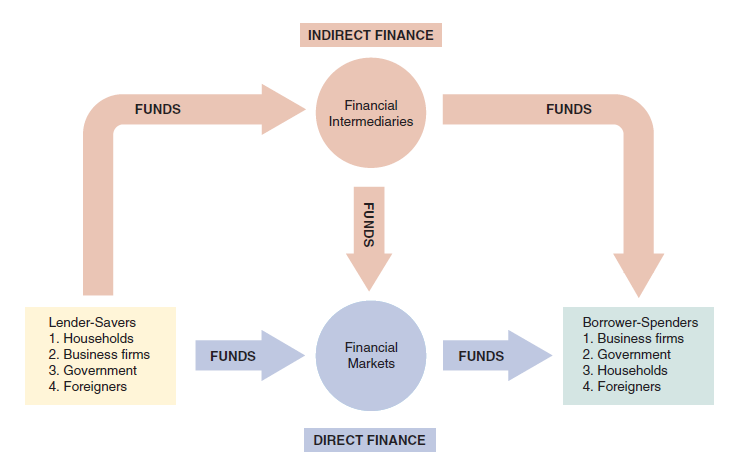
Two routes, the same two parties at each end. Which of the two an economy leans on is the first thing that differs between the systems in this course.
Mishkin & Eakins, Financial Markets and Institutions, 9th Global Edition, Figure 2.1.
Predict before we look
AhaSlides poll · predict before reveal · 4 min
Chinese bank assets are worth how many times China’s GDP?- about 0.8× — roughly the US level
- about 1.5×
- about 2.5×
- about 3.5×
Scan to join
The same two ratios, inverted
China’s banks hold assets worth about 3.5× GDP while its stock market is worth about 0.9×. The US has the mirror image. That pair of numbers is the usual shorthand for the bank-based versus market-based distinction.
US bank assets: FDIC Q1 2026 ($26.1tn) over 2025 GDP (BEA, $30.76tn). China: NFRA Q2 2026 (¥498tn) over 2025 GDP (NBS, ¥140.19tn). Market cap / GDP: US ≈238–244% (14 Aug 2026 — providers differ by about 6pp depending on whether the Wilshire 5000 or Fed Z.1 corporate equities is used); China A-share ≈¥120tn (May 2026) over 2025 GDP. Treat the equity ratios as approximate.
What that difference means in practice
Who monitors the borrower changes with it: a loan officer in one system, a bond market and a ratings process in the other. So does what happens when the borrower gets into trouble.
AFRE share: PBoC, end-July 2026. Ratios derived from FDIC / BEA / NFRA / NBS as on the previous slide.
How much credit does the real economy carry?
Everything households and non-financial companies have borrowed — bank loans plus bonds — divided by that country’s GDP. Private means it excludes what the government borrows; non-financial means it excludes what banks and funds borrow from each other.
The US peaked at 172% in 2008 and has deleveraged since. China now sits about 60 percentage points above the current US level.
BIS credit to the private non-financial sector; US Q4 2025 and China Q3 2025 are one quarter apart. Whether credit has a level beyond which it stops helping growth is contested.
Case — does a financial system have to look like this?
Think – pair – share · 7 min
Think about it on your own first, then talk it over with the person next to you. We will share after that.What five other economies look like
Only the United States has a stock market worth several times its bank credit — about five times. In Japan, Australia, Germany, Brazil and China the two are the same order of magnitude, and in four of the six bank credit is the larger of the pair.
Stock market capitalisation of listed domestic companies, % of GDP: World Bank CM.MKT.LCAP.GD.ZS, 2025. Bank credit to households and non-financial firms, % of GDP: BIS via FRED, Q4 2025. Both series are narrower than the two ratios shown earlier in this session, which used total bank assets and the whole A-share market; use this page for the pattern across countries and the earlier page for the levels.
Session 2 · 45 minutes
How financial markets are organized
Direct and indirect finance
The borrower sells a security straight to the lender. The security is a claim on the borrower’s own future income, so the lender carries the borrower’s credit risk.
The intermediary issues its own claim to the lender and separately holds the borrower’s, so the lender carries the intermediary’s credit risk instead.
Both routes start and end at the same two parties. What differs is whose promise the saver is left holding.
Debt and equity
| Debt | Equity | |
|---|---|---|
| What the holder owns | A contractual promise to pay | A residual claim on what is left |
| Life | Finite — there is a maturity date | Indefinite |
| If the firm does well | Fixed; you get what you were promised | Unbounded |
| If the firm does badly | Enforceable claim, paid before equity | Paid last, often nothing |
| Control | None until default | Voting rights |
That asymmetry in the payoff is where the capital-structure literature starts.
Three ways to cut the same market
Capital market — longer debt, and all equity
Secondary — existing securities change hands; where prices are made
OTC — dealers quote from separate locations
A Treasury bill you buy from a dealer this morning is money market (it matures in under a year), secondary (it was issued weeks ago, so the government receives nothing from your purchase), and OTC (there is no exchange for it). Change any one of the three and the other two still hold.
An instrument that is hard to place on all three at once is usually a new one.
What trades where
| Market | Typical instruments | Covered in |
|---|---|---|
| Money market | Treasury bills, repurchase agreements, negotiable CDs, commercial paper | Week 6 |
| Bond market | Treasuries, agency debt, municipal and corporate bonds | Week 7 |
| Stock market | Common and preferred equity, exchange-traded funds | Week 8 |
One year of maturity is the conventional line between money and capital markets. It is a convention — nothing economic happens at it.
Predict before we look
AhaSlides poll · 3 min
Globally, which is larger — total equity market capitalisation, or total fixed income outstanding?- Equities, by a wide margin
- Equities, narrowly
- Fixed income, narrowly
- Fixed income, by a wide margin
Scan to join
How big are these markets
| Value | As of | |
|---|---|---|
| Global fixed income outstanding | $160.7tn (+10.6%) | 2025 |
| Global equity market capitalisation | $157.8tn (+18.9%) | 2025 |
| US fixed income outstanding | $50.5tn | Q1 2026 |
| US Treasuries | $30.8tn | Q1 2026 |
| corporate bonds | $11.7tn | Q1 2026 |
| commercial paper | $1.4tn | Q1 2026 |
| US equity market capitalisation | $76.9tn (+22.4% y/y) | Q2 2026 |
| Global financial assets, all sectors | ≈ $503tn | 2024 |
Globally the two are almost the same size. Inside the United States, equities are about half as large again as all fixed income outstanding.
SIFMA Fact Book 2026 and Research Quarterly; the three indented lines are the largest parts of US fixed income and do not sum to it. Global financial assets from FSB 2025.
What these markets delivered to the people in them
Almost nineteen years on, the Shanghai index is 36% below its 2007 peak, over a period in which China’s nominal GDP grew roughly fivefold. A stock index is not a reading of the economy behind it.
Index levels: S&P 500 record close 1,565.15 (9 Oct 2007) and 7,748.5 (11 Aug 2026); SSE Composite record close 6,092.06 (16 Oct 2007) and 3,903.7 (20 Aug 2026), checked 21 August 2026 — the two current readings are nine days apart. Price indices, excluding dividends; including them narrows the gap but does not close it. Allen, Qian, Shan & Zhu (2024, JF) trace the A-share shortfall to listing, delisting and governance institutions rather than to China’s growth — Week 8 takes it apart.
Case — where does a payment stablecoin belong?
Think – pair – share · 9 min
Take a position and defend it. There is no settled answer.Meeting 2
Session 3 · Why financial intermediaries exist
Session 4 · China’s financial system and its regulators
90 minutes · intermediaries in general, then China · closes on the regulatory architecture case
Session 3 · 45 minutes
If markets work, why is anyone in the middle?
A saver can lend to a firm directly by buying its bonds or its shares. Most do not. In Germany and Japan indirect finance runs at roughly ten times the size of direct finance, and China’s tilt is larger still.
Transaction costs and risk sharing explain why intermediaries are useful. Information explains why they are hard to replace. One page each.
Why intermediaries exist — 1. Transaction costs
Writing a loan contract, checking the borrower and enforcing repayment costs roughly the same whether the loan is small or large. An intermediary does it thousands of times, so the cost per contract falls, and it can employ people whose whole job is credit assessment.
Low transaction costs are what let the intermediary promise your money back on demand. A deposit earns interest and can still be spent this afternoon. Very few securities do both, and the ones that come close are the subject of Week 6.
Suppose the legal and credit-checking work on one loan costs $2,000, whatever the size of the loan. A household lending $10,000 directly pays 20% of its principal for that work. A bank that pools 500 such households into one $5m loan pays the same $2,000 — 0.04%.
The intermediary’s profit is the gap between what the transaction costs it and what it would have cost you.
Why intermediaries exist — 2. Risk sharing
The intermediary buys risky assets from borrowers and sells safer assets to savers. The two sides of its balance sheet carry different amounts of risk, and that difference is the service it sells.
Take 100 loans, each with a 2% chance of default, failing independently of one another. Lend to one of them and you either lose nothing or lose everything: the standard deviation of your loss is 14%. Hold one-hundredth of each of the 100 instead and the expected loss is still 2%, but the standard deviation falls to 1.4%, and the chance of losing more than 6% is 0.4%.
Same expected return, one tenth of the risk. The intermediary sells that reduction to people who could not achieve it on their own.
Why intermediaries exist — 3. Information
In a financial transaction one side usually knows more than the other. The borrower knows whether the project is sound; the lender does not.
The borrowers most eager to pay a high interest rate are the ones most likely to default, so raising the rate can make the pool of applicants worse.
The intermediary screens applicants before lending.
Once the money is borrowed, the borrower keeps the upside of a risky use of it while the lender carries the downside.
The intermediary monitors the borrower after lending, through covenants, collateral and a continuing relationship.
Screening and monitoring are expensive, and their cost falls with scale in the same way. This is the reason an intermediary is hard to replace.
Four things an intermediary changes about a claim
| Denomination | Many small deposits fund one large loan |
| Maturity | Liabilities redeemable on demand fund long-dated assets |
| Liquidity | A claim you can exit today funds one nobody could sell quickly |
| Risk | A diversified pool is safer than any single loan inside it |
A deposit and the loan it funds differ in every one of these four dimensions. The difference is the product.
Every one of the four is a promise the intermediary can fail to keep. A bank run is one of them failing.
The three types of intermediary
| How they raise funds | What they hold | Examples | |
|---|---|---|---|
| Depository institutions | Deposits, redeemable on demand | Loans, securities, reserves | Commercial banks, savings institutions, credit unions |
| Contractual savings | Contractual periodic payments | Long-dated bonds, equities, mortgages | Life insurers, pension funds |
| Investment intermediaries | Shares, commercial paper, bonds | Diversified securities portfolios | Mutual funds, money market funds, finance companies |
The predictability of the liability side sets what the asset side can safely be.
US intermediaries, then and now
US mutual funds now hold $31.4tn against $26.1tn for every FDIC-insured bank combined. In Mishkin’s edition the ranking is the other way round.
FDIC Quarterly Banking Profile Q1 2026; ICI Investment Company Fact Book 2026 and weekly MMF statistics; ACLI Life Insurers Fact Book; NCUA Q1 2026. End-2015 column from Mishkin & Eakins Ch. 2, Table 2.2.
Non-banks now hold more than half of global financial assets
Why the gap opened
Read it carefully: this counts assets held, not credit created — the FSB’s narrow measure of bank-like credit intermediation is $76.3tn. Either way, Mishkin introduces intermediaries bank-first and the aggregate data point the other way.
FSB, Global Monitoring Report on Nonbank Financial Intermediation 2025 (December 2025; 29 jurisdictions, over 90% of global GDP).
Fewer depositories, by merger
Roughly 8,500 depositories, down about a third from the count Mishkin reports, and the fall has come through merger rather than failure.
FDIC Quarterly Banking Profile Q1 2026; NCUA Q1 2026 (2,672 federal and 1,578 state-chartered). Mishkin Ch. 2 gives roughly 5,000 commercial banks, 900 savings institutions and 7,000 credit unions.
Case — Silicon Valley Bank, 10 March 2023
FDIC failure records and Q1 2026 Quarterly Banking Profile. The 94% uninsured share and the industry-wide mark-to-market loss are from Jiang, Matvos, Piskorski & Seru (2024), Journal of Financial Economics 159, which marked every US bank’s assets to market for 2022Q1–2023Q1 and found an average 10% decline, about $2tn in aggregate.
Cold call · 6 min
Look back at the four transformations. Take one, and say what SVB promised and what it could not deliver.Session 4 · 45 minutes
China’s financial system and its regulators
Same questions, different answers: how large is the intermediary sector, who is in it, and who supervises it.
The shape of China’s financial system
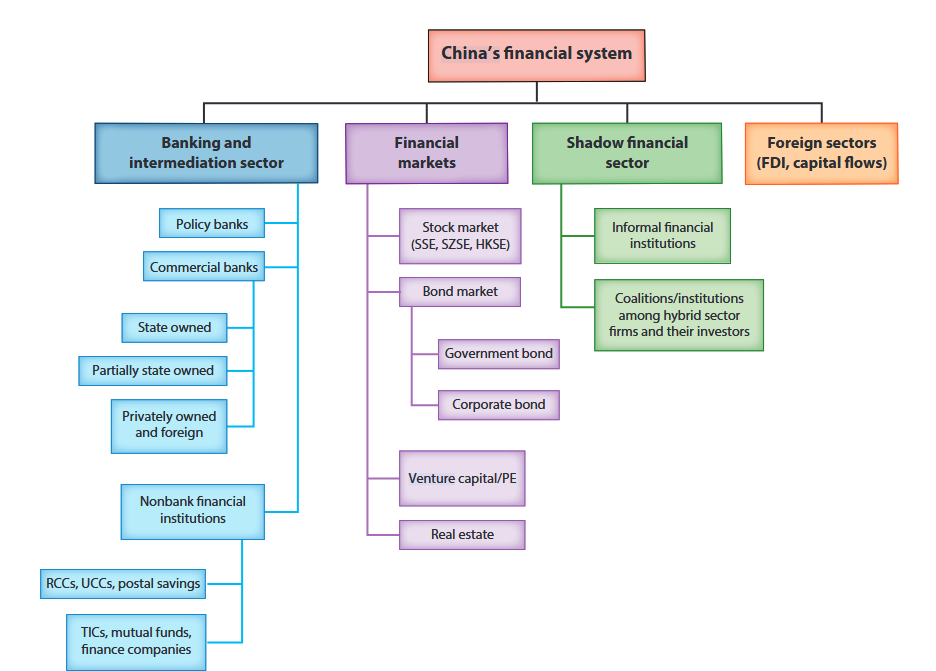
Allen, F., Qian, J. “QJ” & Gu, X. (2017), “An Overview of China’s Financial System,” Annual Review of Financial Economics 9: 191–231, Fig. 1. Structure holds; the magnitudes on the following slides are August 2026.
Scale
The Handbook reports 97% of system assets in banks for 2018. Eight years of capital-market development moved it to roughly 90% — real movement, and slow.
NFRA Q2 2026 indicators; PBoC AFRE release, end-July 2026; OMFIF (March 2026) for the asset-share estimate.
Aggregate financing to the real economy
Every route by which money reaches households and non-financial firms in China, added up in one number: bank loans, plus bonds, plus new equity, plus the off-balance-sheet channels. The central bank publishes it every month, as a flow and as a stock. Also called total social financing.
Nothing published this way. The nearest is the Federal Reserve’s Financial Accounts, which is quarterly, comes out with a lag, and is a statistical release rather than a headline the central bank steers by.
Stock ¥463.27tn, of which bank loans 60.1%, government bonds 22.2%, corporate bonds 7.9%, domestic equity 2.7%.
PBoC, AFRE stock at end-July 2026, reported 14 August 2026.
The direct-financing share is rising, and it is mostly government bonds
Corporate bonds and equity together are 10.6% of total social financing. The rise in direct financing is overwhelmingly sovereign issuance.
PBoC, end-July 2026. Raising the direct-financing share is a stated objective of the 15th Five-Year Plan (2026–2030).
The same measure over twenty years
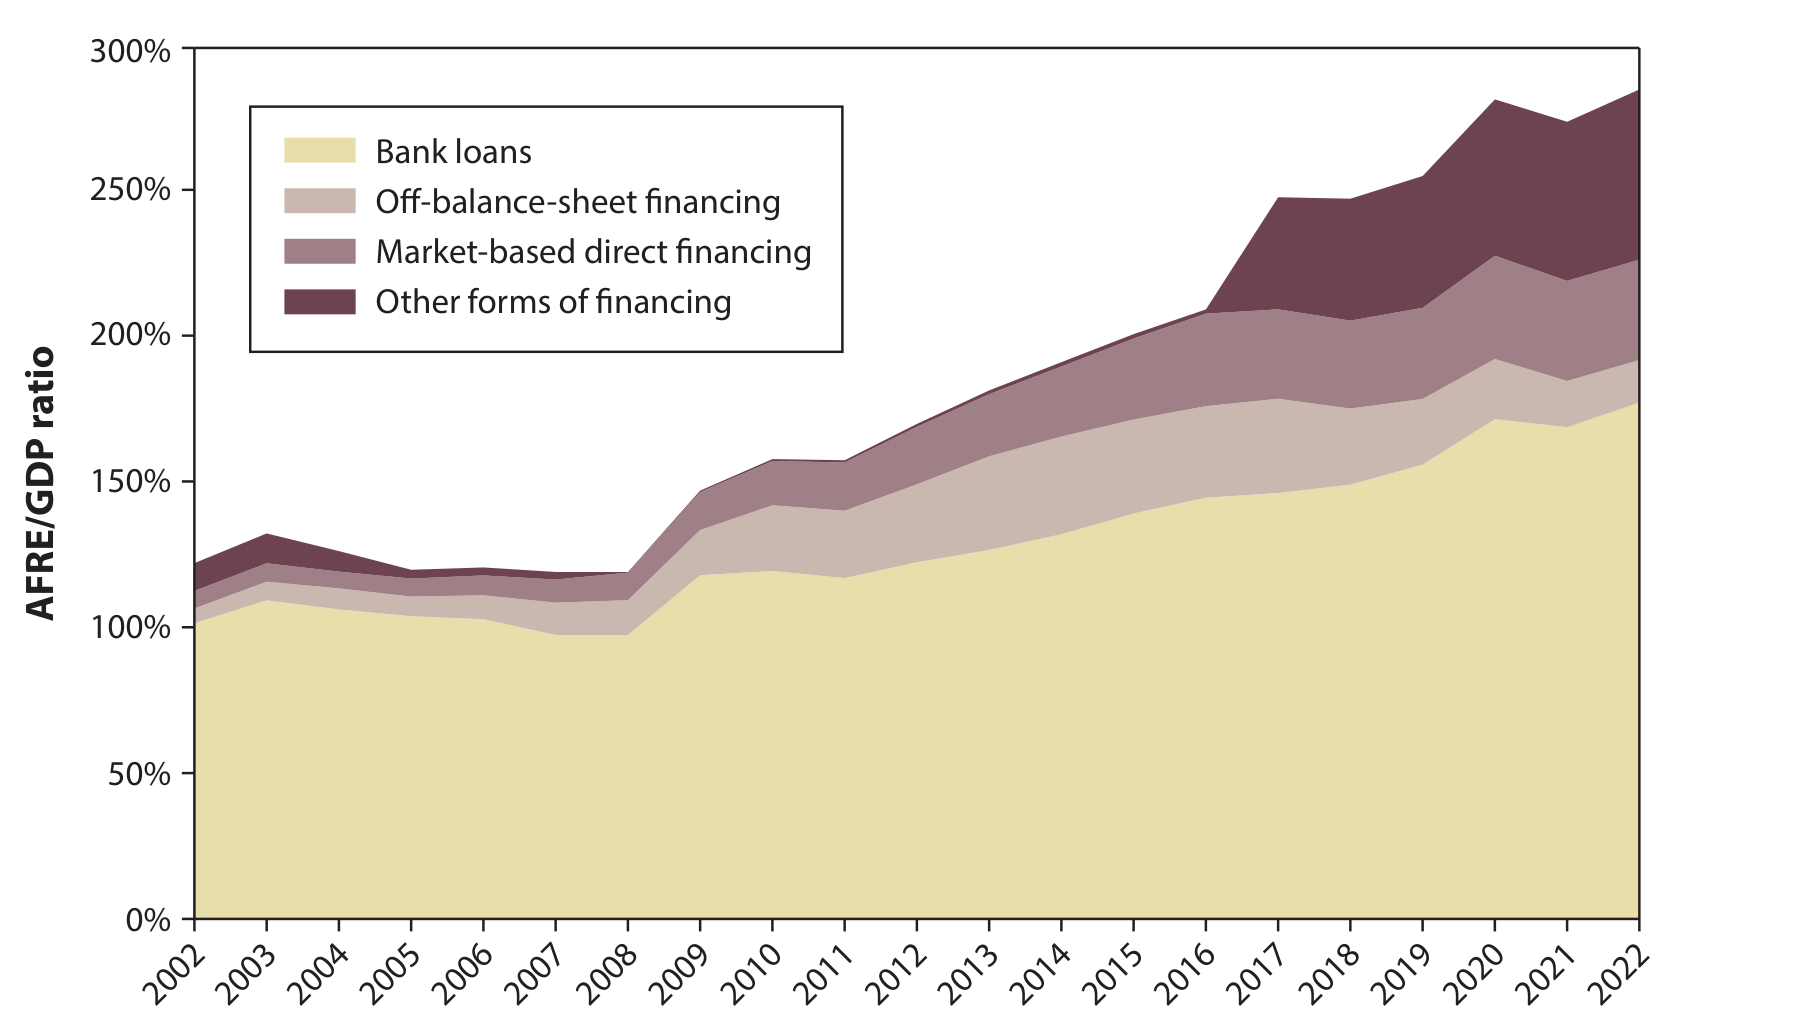
He, Z. & Wei, W. (2023), “China’s Financial System and Economy: A Review,” Annual Review of Economics 15: 451–483, Fig. 1. Series ends 2022; the July 2026 composition is on the preceding slides.
The banking system is tiered
Six large state commercial banks hold 44.5% of all banking assets; joint-stock banks add another 16.1%. City, rural, private and foreign banks share the remaining 39.4%.
NFRA Q2 2026 indicators. Total banking-institution assets ¥498tn; the residual is computed as the balance. Week 10 returns to the bottom of this distribution, where the small-bank consolidation programme is running.
RMB internationalization: three different questions
| RMB | For comparison | As of | |
|---|---|---|---|
| Share of global payments (SWIFT) | 3.10% (5th) | USD 50.10% · EUR 21.88% · GBP 6.71% | June 2026 |
| Share of allocated FX reserves (COFER) | 2.0% | USD 56.8% — a 31-year low | Q4 2025 |
| CIPS participants | 210 direct + 1,619 indirect | of the indirect: Asia 1,157 · Europe 267 · Africa 103 | June 2026 |
The rails reach 1,829 institutions and the currency settles 3.10% of payments, but only 2.0% of reserves. The three questions have three different answers, and they get harder in that order.
SWIFT RMB Tracker (June 2026); IMF COFER Q4 2025; CIPS participant list, June 2026. The payments share moves month to month, so always quote the month with it.
Two regulatory maps
- Federal Reserve, Office of the Comptroller of the Currency and Federal Deposit Insurance Corporation — banks and systemic firms
- Securities and Exchange Commission, Commodity Futures Trading Commission — securities, derivatives
- National Credit Union Administration, Federal Housing Finance Agency — credit unions; the housing agencies (2008)
- Consumer Financial Protection Bureau — consumer protection (2010)
- Financial Stability Oversight Council and Office of Financial Research — systemic risk (2010)
- State banking and insurance commissions
- People’s Bank of China — the central bank; monetary policy and system-wide risk. The State Administration of Foreign Exchange sits under it
- National Financial Regulatory Administration — banking, insurance, financial holding companies, consumer protection
- China Securities Regulatory Commission — securities markets; also enterprise bonds since 2023
- Central Financial Commission — coordination above all three
Short names from here on: Fed, OCC, FDIC, SEC, CFTC, NCUA, FHFA, CFPB, FSOC, OFR; PBoC, SAFE, NFRA, CSRC. The full US table is in the Appendix.
One bank, one administration, one commission
一行一局一会
Monetary policy · system-wide risk · foreign exchange sits under it
Banking · insurance · financial holding companies · consumer protection
Securities markets · enterprise bonds, moved from the planning agency in 2023
Structure as of August 2026. The NFRA runs 27 departments and is absorbing roughly 1,600 county-level PBoC branches into its local network. Director since 5 June 2026: Ding Xiangqun 丁向群.
Three reasons any government regulates finance
The first two protect the saver. The third protects the policy, and it is the reason the central bank is a regulator at all.
Reason 2 in detail — six kinds of rule
| Restrictions on entry | You need a charter to open a bank, and it is granted only with adequate capital and acceptable owners |
| Disclosure | Prescribed accounting, periodic inspection of the books, and information the public can see |
| Restrictions on assets and activities | Limits on what an intermediary may hold and what businesses it may enter |
| Deposit insurance | The state repays small depositors if the institution fails, so they have no reason to run |
| Limits on competition | Branching and entry restrictions. The evidence that competition causes failures is weak |
| Restrictions on interest rates | Ceilings on deposit rates, imposed after the 1930s. Largely abolished; China removed its own ceiling in 2015 |
The first four are the standard toolkit and every one returns in Week 10. The last two were imposed on a belief the evidence did not support, and both have largely been undone.
Main takeaways
- What a financial system does, and how the US and China do it differently
- How financial markets are classified: by maturity, by new or existing, by where they trade
- Why financial intermediaries exist, and what a bank actually produces
- China’s financial system, how it is measured, and who supervises it
- China sends savings through banks, the US through securities markets: bank assets 3.5× GDP against 0.85×
- Theory does not say which channel to use. The rules differ — deposit insurance, listing requirements, who may hold risk
- Intermediaries exist for three reasons: transaction costs, risk sharing, information
- A bank changes four things about a claim: denomination, maturity, liquidity, risk
- Non-banks hold 51% of global financial assets; US mutual funds hold more than all US banks
- China is bank-dominated — loans are 60.1% of aggregate financing — and three bodies supervise it
Questions to Think About
- The US and China route savings to investment through opposite channels. Name one cost of each arrangement that the other avoids.
- A payment stablecoin is redeemable on demand, fully reserve-backed, and not insured. Which of Mishkin’s three reasons for regulation applies to it most strongly?
- Non-banks now hold more than half of global financial assets. Which of this week’s arguments for why intermediaries exist still applies to an institution that takes no deposits?
- China raised its direct-financing share mostly by issuing government bonds. Does that count as capital market development?
These are for you to think about, not to hand in.
Before Next Class
- Mishkin & Eakins, Financial Markets and Institutions, 9th ed. — Chapters 1 and 2
- Amstad, Sun & Xiong (eds.), The Handbook of China’s Financial System — Introduction and Chapter 1. Free from Princeton’s open-access page
- He, Z. & Wei, W. (2023). China’s Financial System and Economy: A Review. Annual Review of Economics 15: 451–483 — the best single survey, and the source of two figures today
- FSB, Global Monitoring Report on Nonbank Financial Intermediation 2025 — skim the summary tables
Week 2 is interest rates and valuation. Assignment 1 is set at the end of that week, so Chapter 3 matters more than usual.
References
- Allen, F., Qian, J. “QJ” & Gu, X. (2017). An Overview of China’s Financial System. Annual Review of Financial Economics 9: 191–231.
- Allen, F., Qian, J. “QJ”, Shan, C. & Zhu, J. L. (2024). Dissecting the Long-Term Performance of the Chinese Stock Market. Journal of Finance 79(2): 993–1054.
- Financial Stability Board (2025). Global Monitoring Report on Nonbank Financial Intermediation 2025.
- He, Z. & Wei, W. (2023). China’s Financial System and Economy: A Review. Annual Review of Economics 15: 451–483.
- Jiang, E. X., Matvos, G., Piskorski, T. & Seru, A. (2024). Monetary Tightening and U.S. Bank Fragility in 2023: Mark-to-Market Losses and Uninsured Depositor Runs? Journal of Financial Economics 159.
- Mishkin, F. S. & Eakins, S. G. (2018). Financial Markets and Institutions, 9th Global Edition. Pearson.
- SIFMA (2026). Capital Markets Fact Book.
Appendix
Optional depth
Covered in class only if time allows. The results you need are in the body.
Appendix — US regulatory agencies in full
| Agency | Supervises | Created |
|---|---|---|
| Federal Reserve | Bank holding companies, state member banks, systemic firms | 1913 |
| OCC | Nationally chartered banks and thrifts | 1863 |
| FDIC | Insured depositories; resolution; the Deposit Insurance Fund | 1933 |
| SEC | Securities issuance, exchanges, disclosure | 1934 |
| CFTC | Futures, options and swaps markets | 1974 |
| NCUA | Federally insured credit unions | 1970 |
| FHFA | Fannie Mae, Freddie Mac, the Federal Home Loan Banks | 2008 |
| CFPB | Consumer financial products and services | 2010 |
| FSOC / OFR | Systemic risk identification; supporting research | 2010 |
The last three rows are absent from Mishkin Ch. 1–2 entirely. Since July 2025 a further regime sits outside all of them: the GENIUS Act carves qualifying payment stablecoins out of SEC and CFTC jurisdiction. Agency heads as of August 2026: Fed chair Kevin Warsh (sworn in 22 May 2026), FDIC chair Travis Hill, Comptroller Jonathan Gould, SEC chair Paul Atkins.
Appendix — three models of supervisory architecture
| Model | Organising principle | Examples |
|---|---|---|
| Sectoral | One regulator per industry — banking, securities, insurance | China, and still the most common model worldwide |
| Integrated | A single regulator for the whole financial sector | Japan, Singapore |
| Twin peaks | One regulator for prudential soundness, one for conduct and consumer protection | Australia, the Netherlands, the UK |
China’s 2023 reform moved consumer protection into the NFRA, borrowing one element of the twin-peaks design without adopting the model.
Appendix — the numbers on one page
| Indicator | Value | As of |
|---|---|---|
| US GDP, nominal | $30.76tn | 2025 |
| China GDP, nominal | ¥140.19tn (~US$20.13tn), +5.0% | 2025 |
| US FDIC-insured banking assets | $26.1tn, 4,278 institutions | Q1 2026 |
| China banking system assets | ¥498tn, +6.6% y/y | Q2 2026 |
| China AFRE stock | ¥463.27tn, +7.4% y/y | end-July 2026 |
| China AFRE: loans / govt bonds / corp bonds / equity | 60.1% / 22.2% / 7.9% / 2.7% | end-July 2026 |
| Global NBFI assets | $256.8tn = 51% of global financial assets | 2024 |
| US money market funds | $7.93tn | 12 Aug 2026 |
| FDIC Deposit Insurance Fund | $153.9bn, reserve ratio 1.43% | Q1 2026 |
| RMB share of global payments | 3.10%, 5th | June 2026 |
Each figure carries its own source on the slide where it appears. All values checked August 2026.