Week 2 · Module 2
Interest Rates: Valuation and Risk
Financial Institutions and Markets · MF50004.01
Prof. Jiajun Jiang · School of Economics, Fudan University · Semester 1, 2026–2027
Where we left off
A financial system moves savings from people who have them to people who can use them. It does this through two channels: directly, through securities markets, and indirectly, through intermediaries such as banks. Countries use the two in very different proportions. The US sends most savings through securities markets; China sends most through banks, whose assets are about 3.5× GDP against 0.85× in the US.
Every claim in a financial system has a price: a loan, a bond, a deposit, a share. Prices decide who can borrow and at what cost, what savers are paid, and what the assets people already hold are worth. The interest rate is one of these prices, the price of using money for a period of time. It is one of the most important, because a loan, a bond or a share is valued by discounting its future payments at an interest rate.
This week: how to price a bond, how its price moves when rates change, and why rates change.
This week
- Present value and yield to maturity
- Real rates, returns, and duration
- Why interest rates change
- China’s rate environment
Reading for the week: Mishkin Chapters 3 and 4.
Meeting 1
Session 1 · Present value and yield to maturity
Session 2 · Real rates, returns, and duration
90 minutes · how to price a bond and measure its risk · closes with the bond lab
Session 1 · 45 minutes
What is a bond, arithmetically?
A bond is a list of future payments and the dates they arrive. Its price is the sum of those payments, each discounted back to today. Two numbers summarise the list: the yield to maturity, the single interest rate at which the discounted payments add up to the price, and duration, the average time until the money comes back, which tells you how much the price falls when rates rise.
Present value
A payment of \( \text{CF} \) received \( n \) years from now is worth less than the same payment today, because today’s money can earn \( i \) in the meantime.
\[ \text{PV} \;=\; \frac{\text{CF}}{(1+i)^{n}} \]A loan, a bond or a bill is a set of payments on different dates. Discount each payment with this formula and add them up: the sum is the price.
Discounting turns payments at different dates into amounts today, so they can be compared and added up.
Four credit market instruments
| Instrument | Cash-flow pattern | Example |
|---|---|---|
| Simple loan | Principal plus interest, once, at maturity | Commercial bank loan |
| Fixed-payment loan | Equal payments every period until maturity; no separate principal repayment | Mortgage, car loan |
| Coupon bond | Fixed coupon each period, face value at maturity | US Treasury note (a US government bond), corporate bond |
| Discount bond | Nothing until maturity; sold below face value | US Treasury bill, zero-coupon bond |
The four differ only in when the payments arrive: once at the end, in equal instalments, as coupons plus a final repayment, or nothing until the end.
Price formulas for the four instruments
In all four, you discount each payment by how long you wait for it, then add. A perpetuity is a coupon bond that never matures (\( n\to\infty \)); its price simplifies to \( P=C/i \).
Finding the interest rate: three worked examples
Borrow 100, repay 110 in a year. \( 100=\dfrac{110}{1+i} \Rightarrow i=10\% \). The yield is the stated rate.
Pay 900 now for 1,000 in a year. \( 900=\dfrac{1000}{1+i} \Rightarrow i=11.1\% \). No coupon; the whole return is the discount.
Borrow 1,000 and repay 126 a year for 25 years. Solve \( 1000=\sum_{t=1}^{25}\dfrac{126}{(1+i)^{t}} \) for \( i \): about 12%. No formula gives \( i \) directly: you try values until the two sides match, which is what a spreadsheet or financial calculator does for you.
Each answer is a yield to maturity: the interest rate that makes the present value of the payments equal to the price.
Yield to maturity
The single interest rate that makes the present value of an instrument’s cash flows equal to its price today. For a coupon bond with coupon \( C \), face value \( F \) and \( n \) years to run:
\[ P \;=\; \sum_{t=1}^{n}\frac{C}{(1+i)^{t}} \;+\; \frac{F}{(1+i)^{n}} \]The market sets the price \( P \); the yield \( i \) is what you solve for. When a bond is quoted “at 4.7%”, 4.7% is the solution to this equation at that day’s price.
This is why a bond’s price and its yield always move in opposite directions.
Worked example: pricing a coupon bond
Face value 100, annual coupon 4, three years to maturity. Take the market yield to be 4.735%, the actual US 10-year Treasury yield on 18 August 2026, so that the numbers are real.
The coupon (4%) is below the market yield (4.735%), so the bond sells below par, that is, below its face value of 100. Whenever a bond’s price is below face value, its yield is above its coupon rate, and the other way round.
Market yield: US 10-year Treasury, 4.735% on 18 August 2026 (Trading Economics). The bond itself is illustrative.
Predict before we look
Think – pair – share · 5 min
Two bonds, both yielding 4.735% today. One matures in 2 years, one in 30. Yields rise by one percentage point. Which loses more, and roughly how much more?- The 2-year loses more
- Roughly the same
- The 30-year loses about 3× as much
- The 30-year loses about 7–9× as much
Think about it on your own first, then talk it over with the person next to you. We will share after that.
Price and yield, drawn
Both lines slope down: when the yield rises, the price falls. The slope measures how much, and the 30-year bond’s line is far steeper than the 2-year’s. Both lines also bend slightly, which is called convexity; it matters only for large changes in yield.
Computed from the pricing equation above: 4% annual coupon, face 100, priced across a range of yields. Illustrative bonds, not quoted securities.
Session 2 · 45 minutes
Real rates, returns, and duration
- Nominal and real interest rates: the quoted rate includes compensation for expected inflation
- Yield and return: what you earn while you hold a bond can differ from the yield you bought at
- Duration and convexity: how much a bond loses when rates rise depends on when its payments arrive
Real and nominal rates
The interest rate you are quoted is the nominal rate \( i \). The Fisher equation splits it into two parts:
\[ i \;\approx\; r + \pi^{e} \qquad\Longleftrightarrow\qquad r \;\approx\; i - \pi^{e} \]What the lender gains for waiting, in goods. At a 2% real rate you can buy 2% more a year from now.
Extra interest to cover rising prices: if prices rise 2.25% a year, you need 2.25% more money.
In August 2026, US households surveyed by the University of Michigan expected prices to rise more than 4% over the next year; prices of inflation-protected bonds implied about 2.25% a year over the next ten.
US inflation-protected bonds (TIPS) pay a real yield of about 2.4%, the highest in 36 months.
University of Michigan year-ahead inflation expectations, above 4% for five months through August 2026; 10-year breakeven inflation 2.25% (Trading Economics, Aug 2026); 10-year TIPS real yield ≈2.4%, a 36-month high (Cresset, 5 Aug 2026).
Which expectation goes into the equation?
Think – pair – share · 5 min
Households say inflation will run above 4%. The bond market prices 2.25%. If you were setting policy, which number would you target?10-year Treasury 4.735% and 10-year breakeven 2.25% (Aug 2026, Trading Economics); 10-year TIPS real yield ≈2.4% (Cresset, 5 Aug 2026); US CPI +3.4% y/y, core +2.5% (July 2026, released 12 Aug — BLS via CNBC); University of Michigan year-ahead expectations above 4% for five consecutive months through August 2026.
The return you earn can differ from the yield you bought at
Hold a bond for one period. Your return has two parts — the coupon, and the change in price:
\[ R \;=\; \underbrace{\frac{C}{P_{t}}}_{\text{current yield}} \;+\; \underbrace{\frac{P_{t+1}-P_{t}}{P_{t}}}_{\text{capital gain}} \]Buy a 30-year bond at par with a 4.7% coupon. A year later yields have risen by one percentage point, and you sell. Your return for the year is about −9%, although the bond paid every coupon on time.
Interest-rate risk and credit risk are separate. A bond that never defaults can still lose you money.
What a 10-point rate rise does to a bond you already own
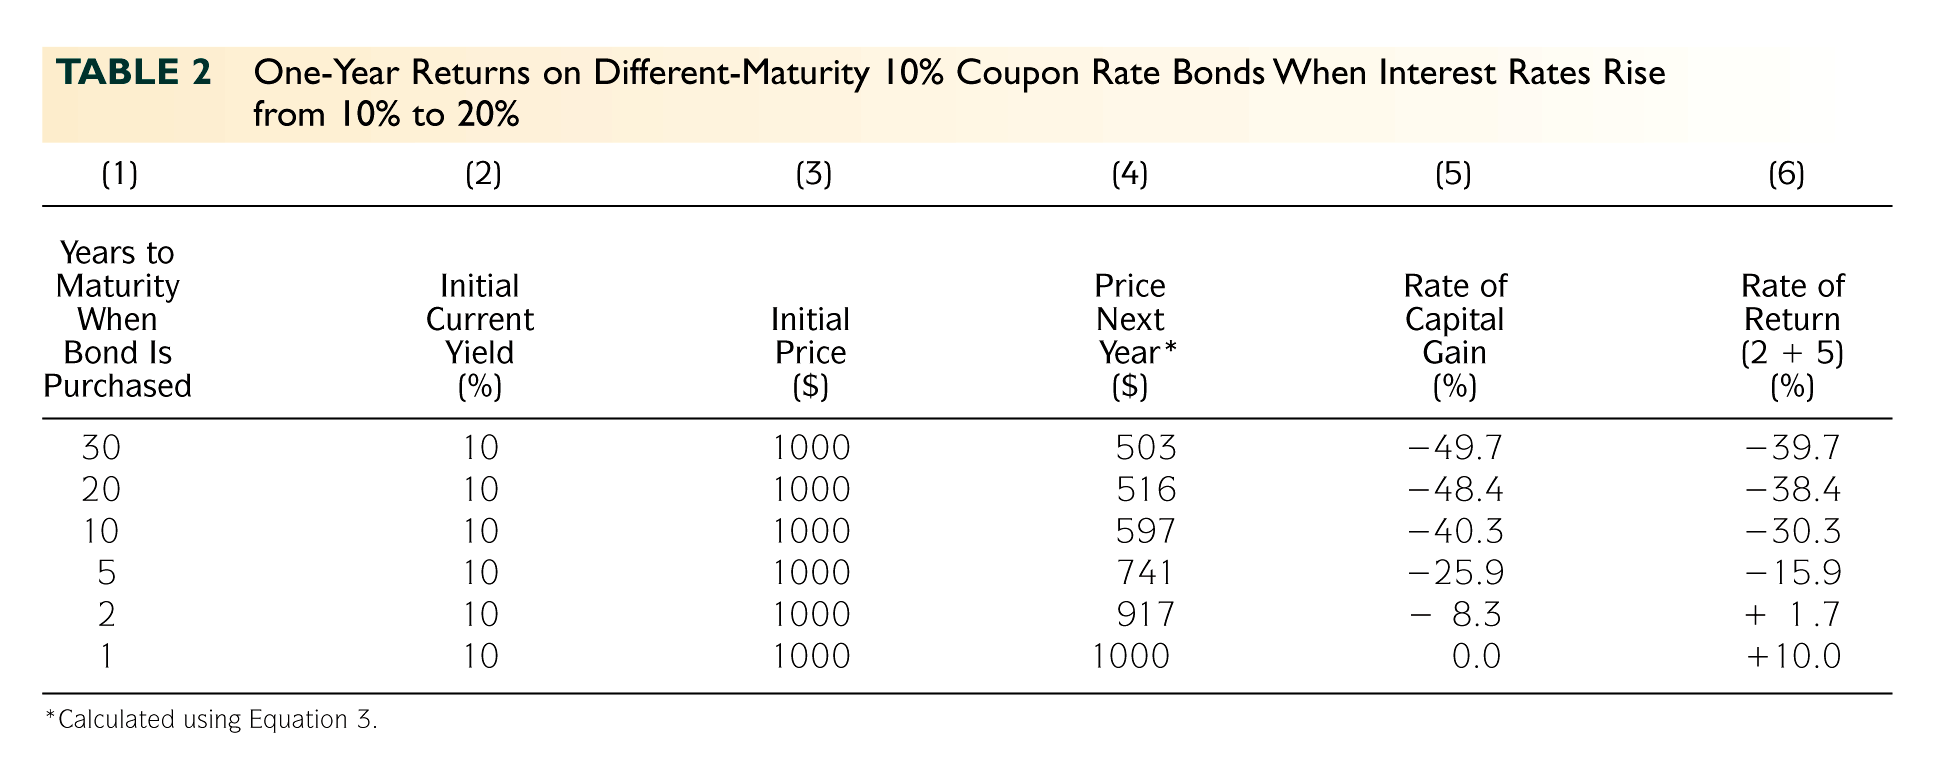
Same coupon, same issuer, same rate move. The one-year bond still returns +10.0%; the thirty-year returns −39.7%, having lost 49.7% of its price. Nothing defaulted.
Mishkin & Eakins, 9th Global Edition, Table 2. An illustrative 10→20% move, larger than anything recent. In 2022–23 the US policy rate rose 5.25 points, and that was enough to contribute to three US bank failures in 2023, which Week 4 covers.
Duration
Weight each payment date by the share of the price that arrives then, and average:
\[ D \;=\; \sum_{t=1}^{n} t \cdot \frac{\text{PV}(\text{CF}_t)}{P} \qquad\qquad D_{\text{mod}} \;=\; \frac{D}{1+i} \]Measured in years. It answers: on average, how long until I get my money back?
It answers: by what percentage does the price fall if the yield rises one point? \( \%\Delta P \approx -D_{\text{mod}} \times \Delta i \). A bond with \( D_{\text{mod}} = 2.75 \) loses about 2.75% when its yield rises one point.
A 30-year zero-coupon bond has a duration of 30. A 30-year bond with a large coupon has a much shorter one, because more of the money arrives sooner.
Duration by maturity and coupon
Check the prediction you wrote down: at 4.735% the 2-year has a duration of 1.96 and the 30-year 17.2 — close to nine times. Most people predict three.
Computed from the definition above for 4% annual-coupon bonds and for zero-coupon bonds, priced at a 4.735% yield. Illustrative.
Worked example: duration, and where the rule fails
The three-year bond from before: face 100, 4% coupon, yield 4.735%, price 97.99.
\[ D=\frac{1(3.82)+2(3.65)+3(90.52)}{97.99}=2.885\ \text{years} \qquad D_{\text{mod}}=\frac{2.885}{1.04735}=2.754 \]If yields rise 1 point, the rule gives 97.99 × (1 − 0.02754) = 95.29, and exact repricing gives 95.34. The rule is off by 0.05.
| Error of the rule, in price | +1 point | +3 points |
|---|---|---|
| 3-year bond | 0.05 | 0.44 |
| 30-year bond | 1.57 | 12.02 |
\( \%\Delta P \approx -D_{\text{mod}}\,\Delta i + \tfrac12\,C\,(\Delta i)^2 \). The second term corrects for the bend in the price line. The 30-year bond’s convexity \( C \) is about 37 times the 3-year’s.
The error grows with the size of the move and with maturity. For the 30-year bond and a 3-point rise, adding convexity cuts it from 12.0 to 3.4.
Both bonds: 4% coupon, face 100, yield 4.735%. Error = exact price minus the rule.
Bond lab — try any bond
- 2-year, then 30-year: yields up 1 point
- 30-year zero-coupon: yields up 1 point, then 5 points
- US, then China 30-year: yields up 1 point. Which loses more?
Each dark bar is one payment’s value today, and the price is their sum. The gold triangle, where the bars balance, is the duration.
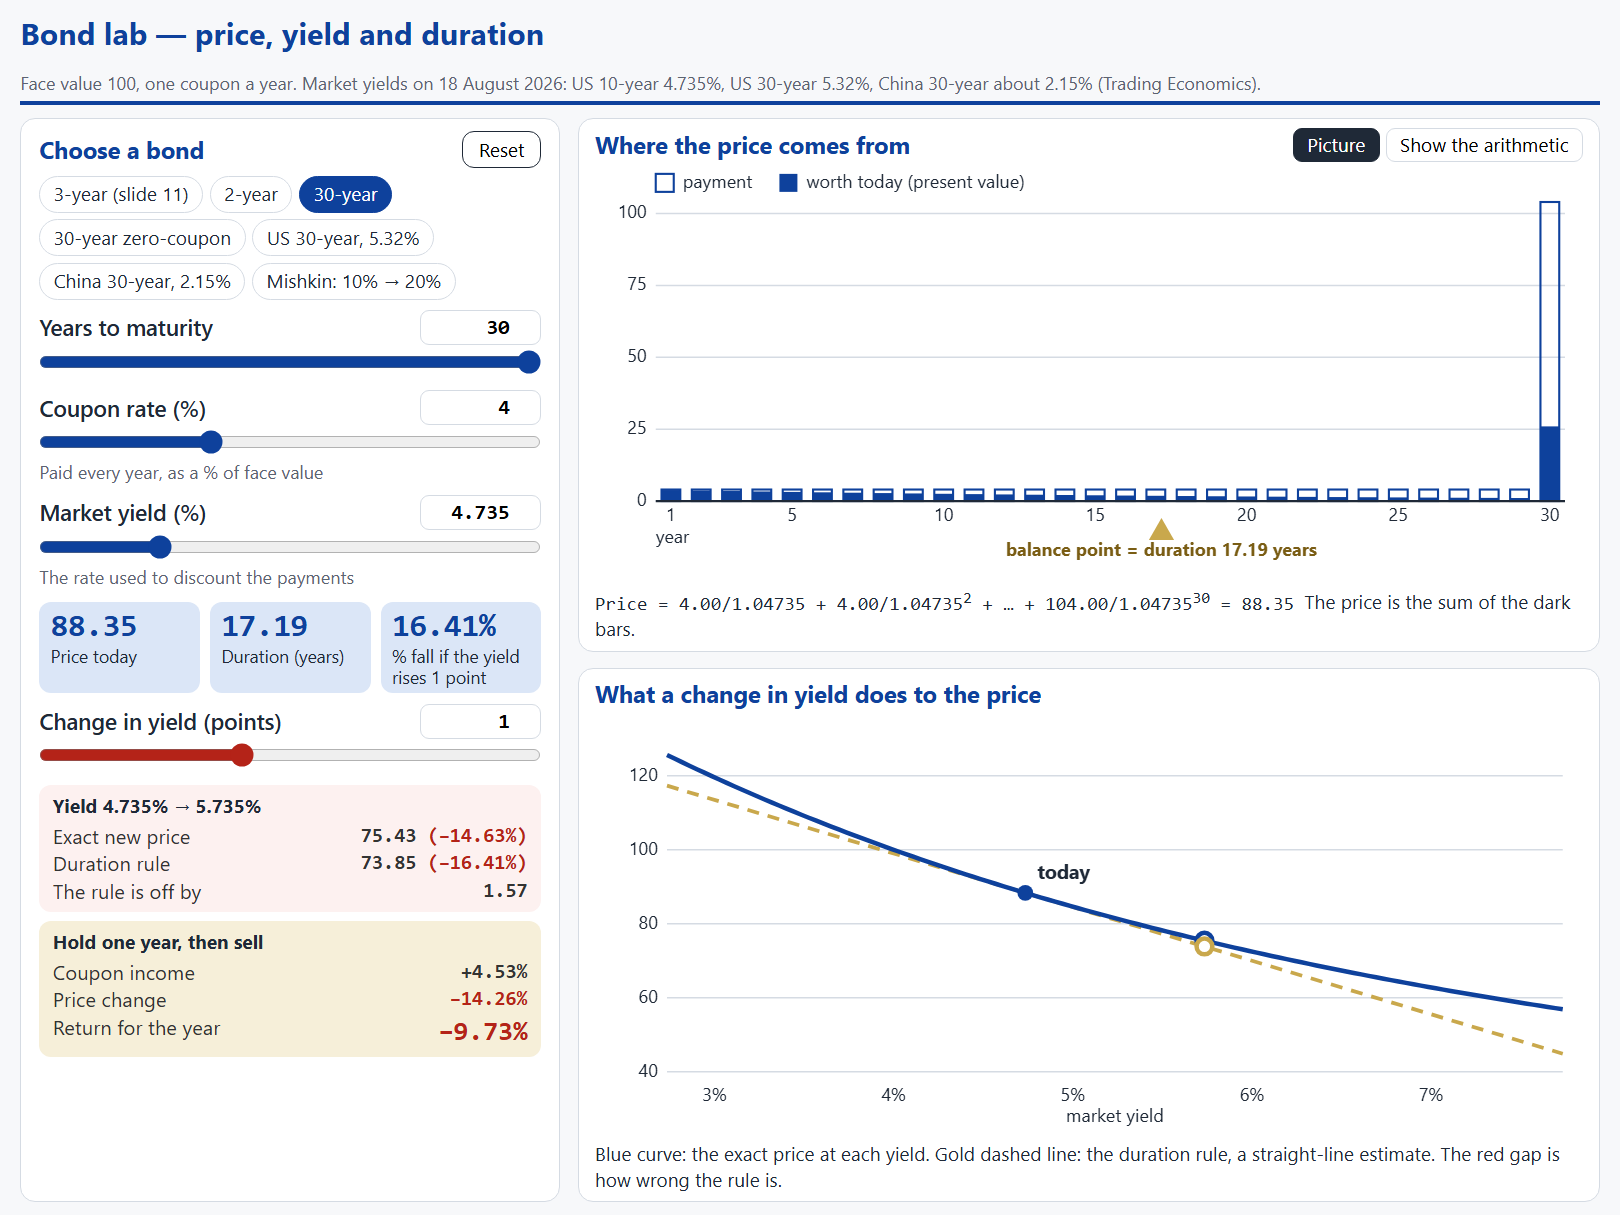
Interactive: set the maturity, coupon and yield, then change the yield and compare the exact price with the duration rule.
fin-tech.fun/courseware/financial-institutions-markets-grad/interactive/W02_bond_lab.html
For a 30-year zero-coupon bond, a 5-point rise in yields cuts the price by 75%. The straight-line duration rule predicts a fall of 143%, which is a negative price.
Meeting 2
Session 3 · Why interest rates change
Session 4 · China’s rate environment
90 minutes · what moves interest rates, then China, where rates are far lower · closes on what Chinese savers did when their products lost money
Session 3 · 45 minutes
Why interest rates change
A bond’s price and its interest rate move in opposite directions, so we can study the interest rate by studying the bond market: what shifts the demand for bonds, and what shifts the supply?
Session 1 taught you to price a bond given a yield. This session is about where that yield comes from.
What shifts the demand for bonds
| If this rises… | Demand for bonds | Bond price | Interest rate |
|---|---|---|---|
| Wealth | Rises | Rises | Falls |
| Expected return on bonds relative to alternatives | Rises | Rises | Falls |
| Expected inflation | Falls | Falls | Rises |
| Risk of bonds relative to alternatives | Falls | Falls | Rises |
| Liquidity of bonds relative to alternatives | Rises | Rises | Falls |
Every row is the same logic: anything that makes bonds more attractive raises their price, and a higher price is a lower yield.
What shifts the supply of bonds
| If this rises… | Supply of bonds | Bond price | Interest rate |
|---|---|---|---|
| Expected profitability of investment | Rises | Falls | Rises |
| Expected inflation | Rises | Falls | Rises |
| Government deficits | Rises | Falls | Rises |
Higher expected inflation lowers the demand for bonds and raises the supply. Both push the interest rate up. This is the Fisher effect from Session 2.
Large government deficits add to the supply of bonds. That is one reason the US 10-year yield rose 43bp in the year to August 2026, although the Fed had cut its policy rate by 1.75 points since September 2024.
Trading Economics, US 10-year Treasury, 18 Aug 2026; Federal Reserve, target range 5.25–5.50% to 3.50–3.75%, Sep 2024 – Dec 2025.
Putting demand and supply together
The bond price, and so the interest rate, is set where the demand for bonds meets the supply.
| What happens | Bond price | Interest rate |
|---|---|---|
| Demand for bonds rises | Rises | Falls |
| Demand for bonds falls | Falls | Rises |
| Supply of bonds rises | Falls | Rises |
| Supply of bonds falls | Rises | Falls |
Saying that expected inflation raises the demand for bonds because debt gets cheaper to repay. That is the borrower’s view: it is why supply rises. Demand comes from lenders, and inflation hurts them.
- Lenders will be repaid in money that buys less, so they want fewer bonds: demand falls.
- Borrowers will repay in money that is worth less, so they issue more bonds: supply rises.
- Both push the bond price down, so the interest rate rises — the Fisher effect from Session 2.
When an interest rate changes, first ask which side of the bond market moved: demand, supply, or both.
Practice: which side of the bond market moved?
Pairs · 6 min
For each headline: does the demand for bonds or the supply of bonds move, and which way? Then: does the interest rate rise or fall?| Headline | |
|---|---|
| 1 | “Government announces a larger budget deficit for next year” |
| 2 | “Stock market falls 10% in a week as investors look for safety” |
| 3 | “New trading platform makes government bonds easier to buy and sell” |
| 4 | “Survey: households now expect 5% inflation next year” |
| 5 | “Recession: firms cut their investment plans and incomes fall” |
Name the side, then the direction, then the price. The interest rate moves the opposite way to the price.
The Federal Reserve’s rate cycle, 2022–2026
Up 525bp in 16 months, down 175bp over 15 months, no change at five meetings — and then, on 16 September 2026, a rise of 25bp to 3.75–4.00%, voted 12–0. The cycle has turned again.
Federal Reserve open market operations table; FOMC statements of 29 July and 16 September 2026. Plotted at the midpoint of the target range.
Session 4 · 45 minutes
China’s rate environment
Everything from Sessions 1 to 3 applies unchanged. What differs is how low and how flat the yield curve is, and who takes the loss when bond prices fall.
Since 2022, when bond prices fall, the loss shows up in Chinese households’ own accounts.
Two government curves, side by side
From three months to thirty years, China’s entire government curve fits inside 95 basis points. The US spans 132bp over the same maturities, at about three times the level.
US: Federal Reserve H.15, 17 September 2026 — 3m 3.97%, 2Y 4.67%, 10Y 4.94%, 30Y 5.29%. China: ChinaBond government bond yield curve, 18 September 2026 — 3m 1.18%, 10Y 1.68%, 30Y 2.13%. Plotted on a shared maturity axis; ChinaBond publishes no 2-year point.
Which rate is the policy rate?
| Rate | Level | What it is | Since |
|---|---|---|---|
| 7-day reverse repo (a one-week central-bank loan to banks) | 1.40% | The main policy rate of the People’s Bank of China (PBoC) since June 2024 | 8 May 2025 |
| Loan Prime Rate (LPR), 1-year | 3.00% | Benchmark for corporate lending, quoted by 20 banks | 20 May 2025 |
| LPR, over 5-year | 3.50% | Benchmark for mortgages | 20 May 2025 |
| 1-year time deposit | 0.95% | Agreed among the banks, under central-bank guidance | 20 May 2025 |
| Demand deposit | 0.05% | 20 May 2025 |
Note the gap between the policy rate (1.40%) and what a saver is paid (0.95%), and between the policy rate and what a borrower pays (3.00%). Those two gaps are the banks’ margin, and both are managed through official guidance.
PBoC; gov.cn, 20 May 2026 LPR fixing; deposit rates from gov.cn and Yicai, 20 May 2025. The 2024 framework change is covered in Week 5; the deposit mechanism in Week 6.
How China’s long rate got here
A rate falls when demand for bonds rises or supply falls. Here it is both: savers have few other good places for their money, and fewer borrowers are issuing new debt.
Trading Economics, China 10-year government bond yield.
Why China’s long rate fell
Aggregate financing growth fell from 9% in July 2025 to 7.4% in June 2026. Infrastructure and manufacturing loan growth fell from nearly 20% in 2023 to about 10% in 2025.
Deposit rates: gov.cn and Yicai, 20 May 2025. Financing growth: Caitong Securities, reported July 2026. Bank bond yield: CEIC, June 2026.
Where the savings went, and what changed in 2022
- Wealth-management products quoted an expected return
- Principal was, in practice, implicitly guaranteed by the issuing bank
- A bond-market loss was absorbed by the bank, and the investor never saw it
- Savers treated them as deposits paying more
- Mandatory net asset value accounting, under the 2018 asset-management rules
- No guarantee, explicit or implicit
- A bond-market loss shows up in the investor’s account, daily
- In effect, the product is now a fund valued at market prices every day
The rule was written to end implicit guarantees. It also meant that when bond prices fell, households took the loss directly: the interest-rate risk from Session 2.
The market recovered, and grew
With safe assets paying so little, managers have moved money into mutual funds and mixed-asset portfolios, and have lowered the returns they advertise. In June 2026 Bank of China Wealth Management cut its target-return ranges by 1.27 points at the bottom and 1.67 points at the top.
Household savings are again in products valued at market prices, and are moving into riskier assets. That is the combination the 2022 rule change created, now with more risk.
Caixin, 29 July 2026; Caitong via BigGo, July 2026.
Research Spotlight
2022 was the first year these products had to report their market value every day. In mid-November bond yields rose, and by the 17th 2,024 of 34,382 products had fallen below their starting value of 1.0. Savers who had treated them as deposits asked for their money back, and managers sold a record ¥1.3 trillion of bonds that month to pay them.
- Question
- The rules ended principal guarantees from 2022. Did investors actually stop believing in them?
- Identification
- Money flowing into and out of each product from July to December 2022, compared across net asset values and across how often a product can be redeemed; the calm months (July–October) against the sell-off (November–December)
- Number
- No significant outflows just below 1.0, and small inflows at 0.9985. Outflows begin at 0.9975. In the sell-off, flows responded four times as strongly to past returns as in the calm months
- So what
- The guarantee had ended on paper, but investors acted as if it still existed until the loss reached a quarter of a per cent. Products that could be redeemed less often saw smaller outflows
Wang, Y. & Wu, Z. (2026). Investors Awaken: Fragility in China’s Wealth Management Product Market. Journal of Empirical Finance 87, 101716.
November 2022 figures: Wind data via Caijing (Sina Finance, 17 Nov 2022); Bloomberg, 19 December 2022.
Main takeaways
- Pricing a bond: present value and yield to maturity, for four kinds of credit-market instrument
- Real and nominal rates, return versus yield, and duration
- What moves interest rates: the supply of and demand for bonds
- China’s interest rates, and what happened when wealth-management products moved to market valuation
- A bond’s price is its payments discounted to today, and price and yield move in opposite directions
- Real rate ≈ nominal rate minus expected inflation; the US 10-year real yield is about 2.4%
- A bond can lose money without defaulting: on a 10-point rate rise, Mishkin’s 30-year bond returns −39.7% in a year
- Duration measures interest-rate risk: at 4.735% the 2-year has duration 1.96, the 30-year 17.2
- Rates rise when the supply of bonds rises (deficits) or demand falls (expected inflation, risk, less liquidity)
- China’s 10-year yield is 1.68% against 4.94% in the US; in November 2022 over 2,000 wealth-management products fell below 1.0
Questions to Think About
- China’s whole government curve fits in 95 basis points. Which of the reasons for an upward sloping curve can still be operating, and which cannot?
- Net asset value accounting moved interest-rate risk from bank balance sheets to household accounts. Name one thing that got better and one that got worse.
- The Fed cut 175bp and the 10-year rose. If the policy rate does not set the long rate, what is monetary policy actually doing to the yield curve?
Before Next Class
- Mishkin & Eakins — Chapters 3 and 4
- Start Chapter 5 (risk and term structure) — Week 3 opens on it
- Wang, Y. & Wu, Z. (2026). Investors Awaken: Fragility in China’s Wealth Management Product Market. Journal of Empirical Finance 87, 101716 — today’s Spotlight; the introduction alone is worth reading
- Amstad, Sun & Xiong (eds.), The Handbook of China’s Financial System, Chapter 4 — China’s interest-rate liberalization
Week 3 opens with the yield curve: why long rates differ from short ones, and why China’s curve is so flat.
References
- Greenwood, R. & Vayanos, D. (2014). Bond Supply and Excess Bond Returns. Review of Financial Studies 27(3): 663–713.
- Jiang, E. X., Matvos, G., Piskorski, T. & Seru, A. (2024). Monetary Tightening and U.S. Bank Fragility in 2023. Journal of Financial Economics 159.
- Mishkin, F. S. & Eakins, S. G. (2018). Financial Markets and Institutions, 9th Global Edition. Pearson — Chapters 3 and 4.
- Rogoff, K., Rossi, B. & Schmelzing, P. (2024). Long-Run Trends in Long-Maturity Real Rates, 1311–2022. American Economic Review 114(8): 2271–2307.
- Wang, Y. & Wu, Z. (2026). Investors Awaken: Fragility in China’s Wealth Management Product Market. Journal of Empirical Finance 87, 101716.
Market data on every slide carries its own source line and date. All values checked August 2026.
Appendix
Derivations
Everything the body states without proving. Covered in class only if time allows.
Appendix — duration and the price approximation
Start from the price of a bond as a function of its yield, and differentiate:
\[ P(i)=\sum_{t=1}^{n}\frac{\text{CF}_t}{(1+i)^t} \qquad\Longrightarrow\qquad \frac{dP}{di}=-\sum_{t=1}^{n}\frac{t\,\text{CF}_t}{(1+i)^{t+1}} \]Divide by \( P \) and rearrange so the sum becomes a present-value-weighted average of the dates:
\[ \frac{1}{P}\frac{dP}{di}=-\frac{1}{1+i}\sum_{t=1}^{n} t\,\frac{\text{CF}_t/(1+i)^t}{P} =-\frac{D}{1+i} \equiv -D_{\text{mod}} \]The next term of the expansion adds convexity: \( \%\Delta P \approx -D_{\text{mod}}\,\Delta i + \tfrac12\,C\,(\Delta i)^2 \), with \( C=\frac{1}{P}\sum_{t=1}^{n}\frac{t(t+1)\,\text{CF}_t}{(1+i)^{t+2}} \).
\( \%\Delta P \approx -D_{\text{mod}}\,\Delta i \). It is a first-order approximation, so it is accurate for small moves and understates the gain and overstates the loss for large ones — that is the convexity you saw in the price-yield curve.
Appendix — the Fisher equation, exactly
The exact relation between the nominal rate \( i \), the real rate \( r \) and expected inflation \( \pi^{e} \) is multiplicative:
\[ (1+i)=(1+r)(1+\pi^{e}) \qquad\Longrightarrow\qquad r=\frac{1+i}{1+\pi^{e}}-1 \]Expanding gives \( i = r + \pi^{e} + r\pi^{e} \). The cross term is small at low rates, which is why the additive approximation \( i \approx r + \pi^{e} \) is standard — but at 1970s or emerging-market inflation rates it is not negligible.
| \( r \) | \( \pi^{e} \) | Approximate \( i \) | Exact \( i \) |
|---|---|---|---|
| 2% | 2% | 4.00% | 4.04% |
| 2% | 10% | 12.00% | 12.20% |
| 2% | 50% | 52.00% | 53.00% |
Appendix — the numbers on one page
| Indicator | Value | As of |
|---|---|---|
| Fed funds target range | 3.75–4.00% (raised 25bp, 12–0) | 16 Sep 2026 |
| Peak of the hiking cycle | 5.25–5.50% | 27 Jul 2023 |
| US 3m / 2Y / 10Y / 30Y | 3.97% / 4.67% / 4.94% / 5.29% | 17 Sep 2026 |
| US CPI / core · TIPS real / breakeven | +3.4% / +2.5% · ≈2.4% / 2.25% | Jul–Aug 2026 |
| China 3m / 1Y / 10Y / 30Y CGB | 1.18% / 1.23% / 1.68% / 2.13% | 18 Sep 2026 |
| PBoC 7-day reverse repo · LPR 1Y / 5Y+ | 1.40% · 3.00% / 3.50% (unchanged since 20 May 2025) | Aug 2026 |
| Big-bank deposit rates | demand 0.05%; 1Y 0.95%; 3Y 1.25%; 5Y 1.30% | since 20 May 2025 |
| China wealth-management products | ¥33.7tn (~US$5tn), +≈10% y/y; H1-2026 return 2.05% | end-Jun 2026 |
| Nov 2022 wealth-management sell-off | 2,024 of 34,382 below 1.0; ¥1.3tn of bonds sold | Nov 2022 |
Each figure carries its own source on its own slide. Market levels 17–18 Sep 2026; the Sessions 1–2 worked examples keep their August curve.